

There is a famous quote popularized by Mark Twain that has always stuck with me:
“There are three kinds of lies—lies, damned lies, and statistics.”
Depending on your perspective, commercial real estate data can feel as if it’s either murky or straightforward. Unfortunately, most analyses overlook key nuances that provide an accurate picture of what’s happening within the CRE market, focusing only on macro headlines and data that doesn’t exactly speak to what’s taking place on a micro level. Thus, the importance of applying analytics in a way that demonstrates the greater story—telling clients where they’ve been (and why), while pointing with conviction to where they are going. That is where true value is created.
Along those lines, it’s imperative to identify actionable insights from real estate data tracked. This requires in-depth analysis that reveals trends beyond the basic headlines found in any report. While working with clients across the country this past year, our focus has been to layer in loan and distress information alongside standard inventory, vacancy, and net absorption numbers.
For example, the increasing number of office assets being converted to other uses, those in financial limbo based on looming foreclosure, and owners that are simply opting to put a pause on deals all need to be accounted for within overall statistics. If there is a meaningful enough number of buildings in each market coming offline or unable to transact–shouldn’t that be factored into our market analyses? Clearly.
So, we embarked on the painstaking process of going building by building in each of our submarkets to create an in-depth stoplight analysis.
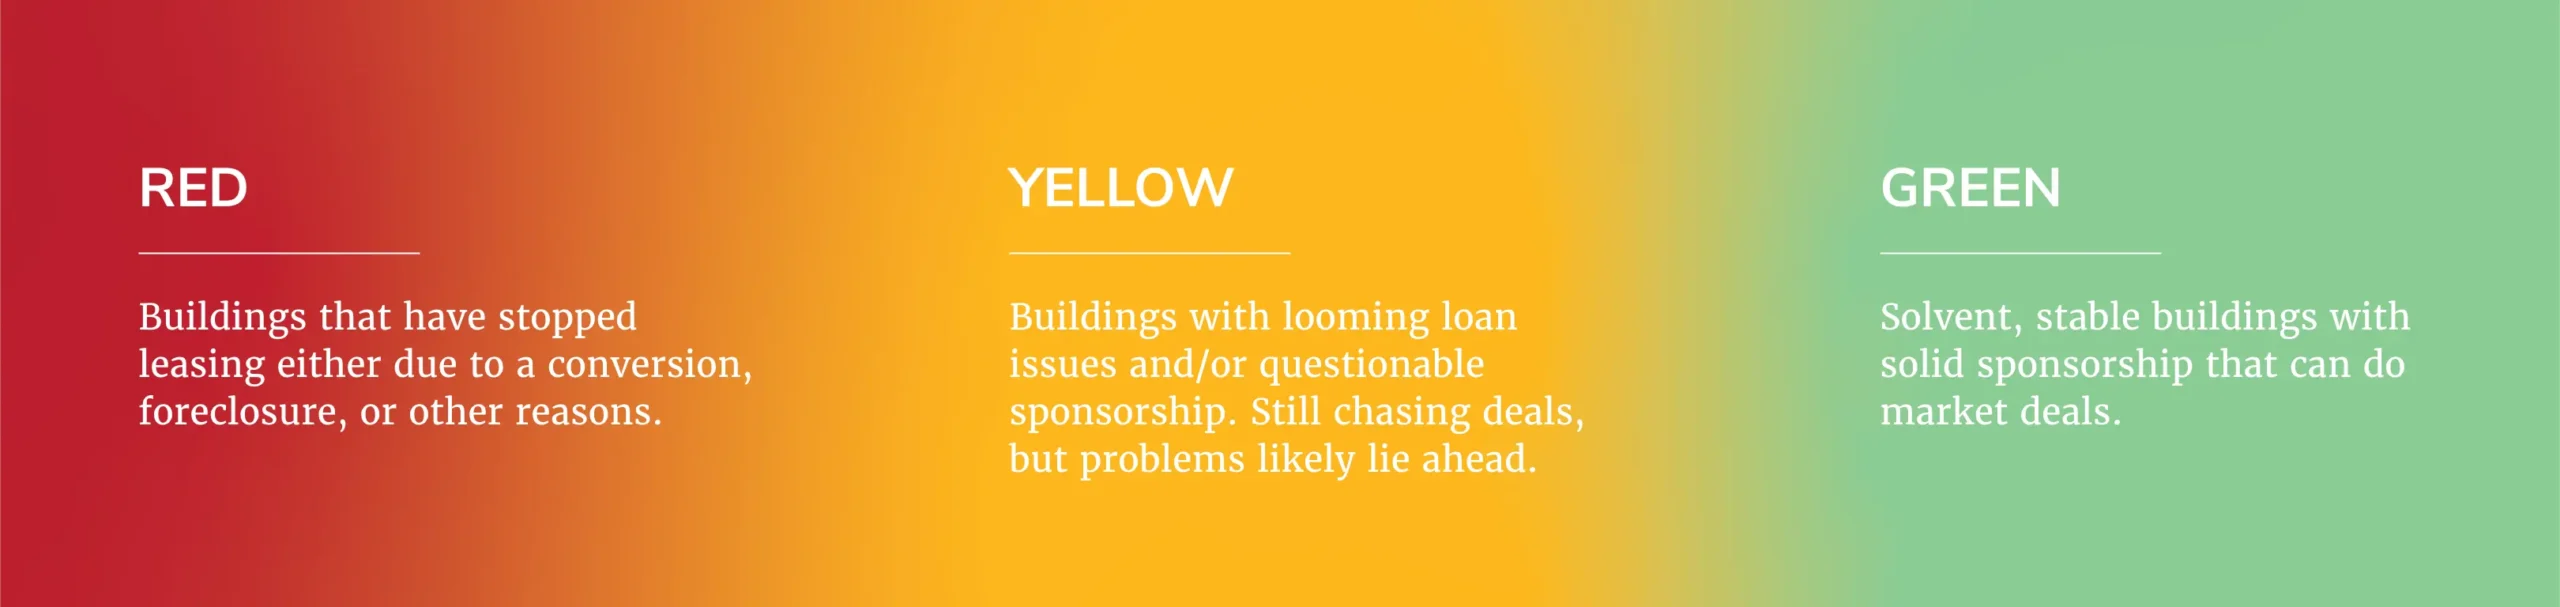
In using just one major northern Virginia submarket as an example, this recalibration resulted in the following changes to the overall market statistics:
• Red resulted in the removal of 10% of the office market inventory, or more than 2 million square feet—creating a 40-basis point reduction in headline vacancy.
• Yellow equated to more than 30% of the total market inventory.
• Green was still a majority at 60% of the market.
And, if you evaluated the vacancy of just the solvent buildings in the market, it was 25%+ less than the headline vacancy.
The conclusion?
While macro headlines are still very soft, for owners in a solid financial position, the competitive landscape is not actually as grim as general real estate reports make it seem.
As we brace for the challenges presented by CRE loans maturing in 2024, this comprehensive evaluation not only uncovers new opportunities but also equips strong ownership clients to thrive irrespective of prevailing market conditions. In essence, it’s not just about deciphering the statistics; it’s about crafting a narrative that empowers owners to navigate the complexities of the CRE market with strategic foresight and unwavering resilience.